Field-Proven Results
HYATCS Case Studies:
Energy Savings in the Real World
See how automatic online condenser tube cleaning cuts energy, protects uptime and shortens payback across data centers, petrochemical plants, desalination and commercial buildings.
10–30%
Typical chiller energy savings
12–30
Months simple payback
4+
Core industries served
24h
Project proposal turnaround
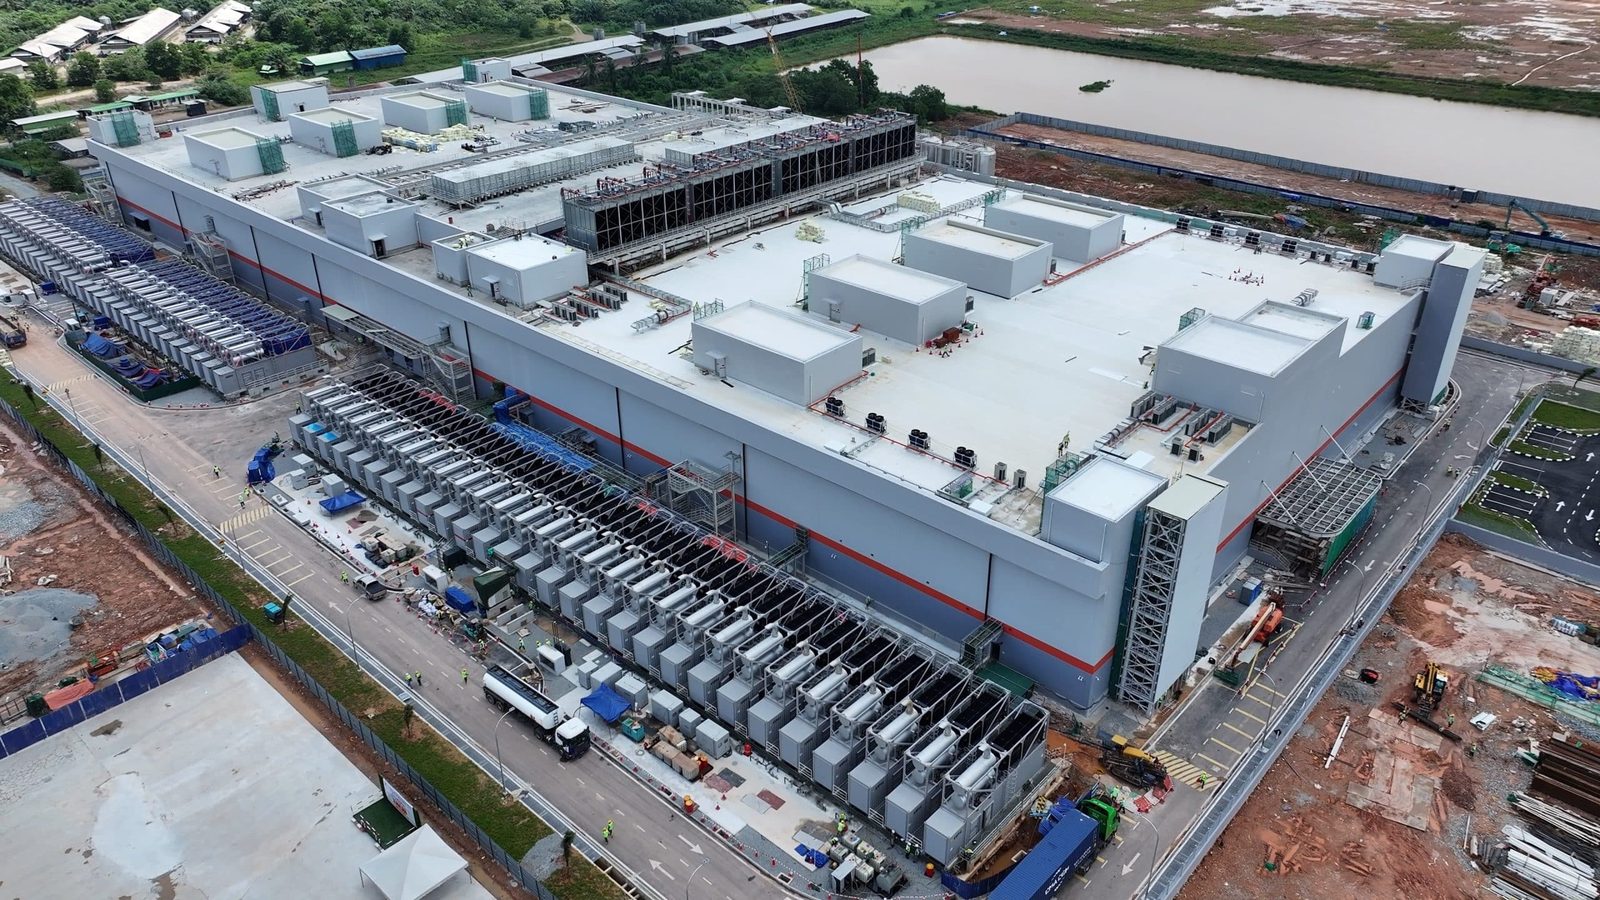
PDG Data Center
Malaysia · Tropical Hyperscale Facility
PDG Data Center, Malaysia
Among our Southeast Asia references, the PDG data center project in Malaysia shows why condenser cleanliness is now a PUE issue, not just a maintenance item. The facility cools its IT load with water-cooled chillers whose condensers are the single largest steady-state energy consumer after the servers themselves.
Background
Chillers run 24/7 under high tropical wet-bulb conditions.
Challenge
Shutdown is not an option; fouling rebuilds within weeks.
Solution
HYATCS units sized to tube count, metallurgy and ball grade.
Specific figures for the PDG Malaysia project will be published against the site’s own commissioning and verification report. HYATCS does not attribute precise numbers to a named client without validated measurement data.
Get a project-specific estimate →
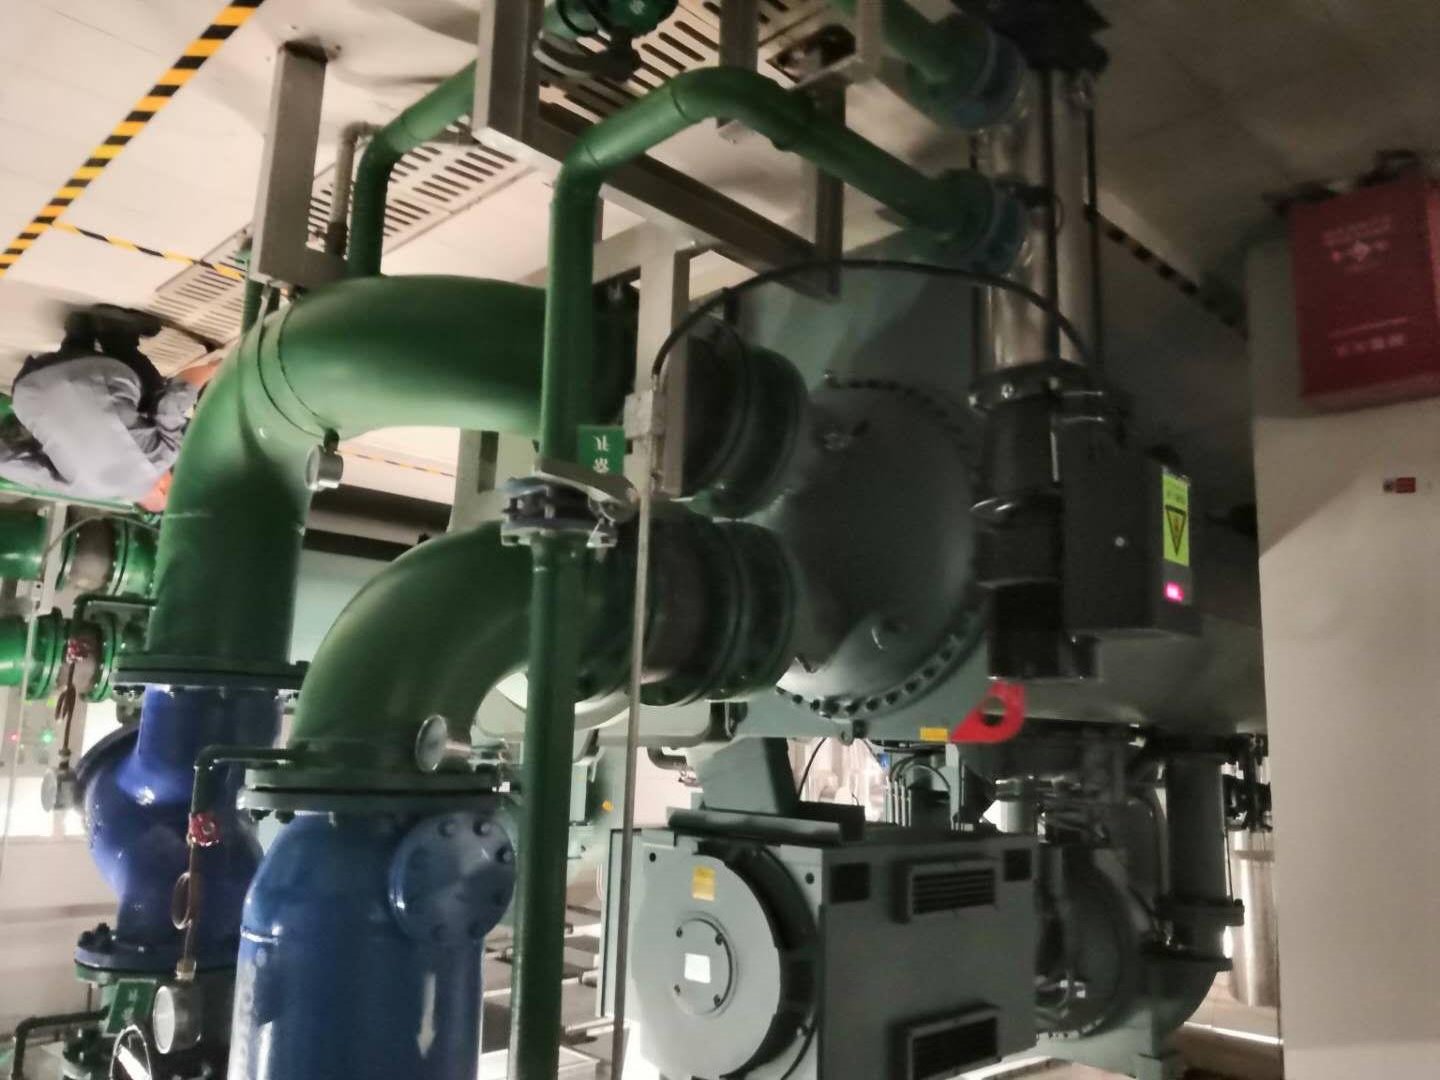
Raffles City
Commercial Complex · 9 × 800 RT York Chillers
Raffles City — Documented Energy Savings Since 2017
Raffles City runs nine 800 RT York centrifugal chillers (356 kW motor each) in its main air-conditioning chiller room. All nine units have been equipped with HYATCS automatic online condenser cleaning since commissioning in March 2017, averaging about 1,500 operating hours per unit per year.
Background
Open cooling towers draw in dust and microorganisms; scale steadily coats the condenser tubes.
Challenge
Fouled tubes force compressors to work harder — chiller efficiency is the site’s top energy concern.
Solution
HYATCS installed on all nine chillers — continuous online cleaning, zero production interruption.
Measured Results — August 2019 operation records
1.5°C
Avg. approach temperature difference (chiller #1)
>4%
Compressor power saving vs. units without online cleaning
21,360 kWh
Annual energy saved per unit (×9 units)
| Date (2019) |
Condensing Temp (°C) |
Outlet Water Temp (°C) |
Load Current (%) |
Approach Diff (°C) |
Min Diff @ Full Load (°C) |
| Aug 1 |
36.0 |
34.9 |
96 |
1.1 |
1.2 |
| Aug 2 |
36.3 |
35.1 |
97 |
1.2 |
1.3 |
| Aug 5 |
36.6 |
35.3 |
97 |
1.3 |
1.4 |
| Aug 8 |
36.8 |
35.4 |
85 |
1.4 |
1.6 |
| Aug 14 |
37.5 |
36.2 |
86 |
1.3 |
1.6 |
| Aug 17 |
37.1 |
35.9 |
83 |
1.2 |
1.6 |
Chiller #1, noon readings.
Savings estimated per GB 50736-2012 (every 1°C of condensing-temperature rise adds 3–4% to compressor power per unit of cooling capacity). The >1°C approach-temperature advantage over units without online cleaning yields an average power saving above 4%: 356 kW × 4% × 1,500 h ≈ 21,360 kWh per unit per year (all nine units combined → a six-figure RMB saving annually at the local electricity tariff). Indirect benefits: no frequent end-cover disassembly, longer chiller service life and lower maintenance cost.
Get a project-specific estimate →
Representative Results
Across comparable tropical data-center chiller installations, continuous online cleaning typically delivers:
3–10
°F reduction
Condenser approach temperature
10–30%
Energy saving
On conditioned cooling load
0.02–0.05
PUE improvement
At facility level
12–30
Months payback
Faster where power is expensive
Other Industry Applications
Petrochemical & Refining
- Protects vacuum and stabilizes compressor load
- Reduces chemical-cleaning frequency
- Tracks the same 10–30% energy savings band
Coastal Power & Desalination
- Fights biofouling and macro-fouling in seawater
- Protects heat-transfer area
- Lowers biocide dosing and pretreatment load
Hotels & Large Commercial Buildings
- Reduces summer peak demand and tenant complaints
- Extends compressor life
- Direct OPEX and CapEx benefit
What a Typical Deployment Looks Like
1
Survey
Collect condenser model, tube count, material, water source, flow rate and operating temperature.
2
Match
Ball grade, hardness and recovery-screen sizing matched to tube metallurgy to avoid abrasion.
3
Install
Mounts on the condenser water box with minimal piping change; most retrofits need no shutdown.
4
Commission
Siemens touch-screen control is set to the site cycle; on-site support verifies recovery.
5
Verify
Approach-temperature and energy baselines compared before/after to quantify savings.
Frequently Asked Questions
Will HYATCS work on my specific condenser? +
In most cases yes. We size the system to tube count and metallurgy and confirm compatibility during survey. Titanium, copper-nickel, stainless and carbon-steel tubes are all supported with matched ball grades.
Does it interrupt operation? +
No. The balls circulate inside the existing water box; the chiller keeps running. Retrofits are normally done without a production shutdown.
How long until payback? +
Across the references above, simple payback is typically 12–30 months, shortening where electricity cost or capacity constraints are high. A site-specific estimate comes from your survey data.
How do we start? +
Send your condenser model, tube size, flow rate and application via our contact page and we return a matched proposal within 24 hours.
Ready to benchmark your site?
Tell us your condenser model, tube size, flow rate and application. We’ll return a matched proposal and ROI estimate within 24 hours.
More Documented Project Reports
Beyond Raffles City, two more full user reports — with one-year operating data — are published as standalone case studies:
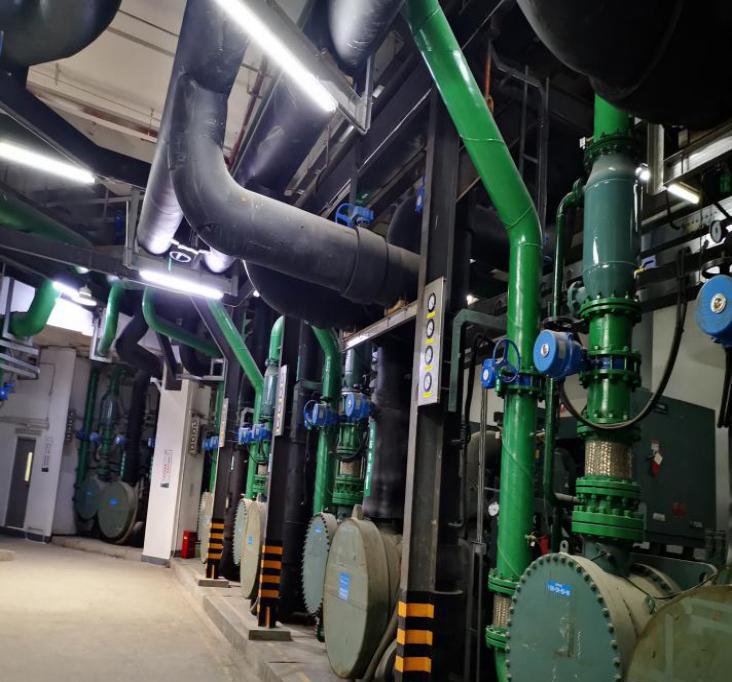
Changsha IFS — 22-Chiller Retrofit
Approach temperature 3.0°C → 1.2°C · 7.2% energy saving · 93,960 kWh per unit per year.
Read the full case study →
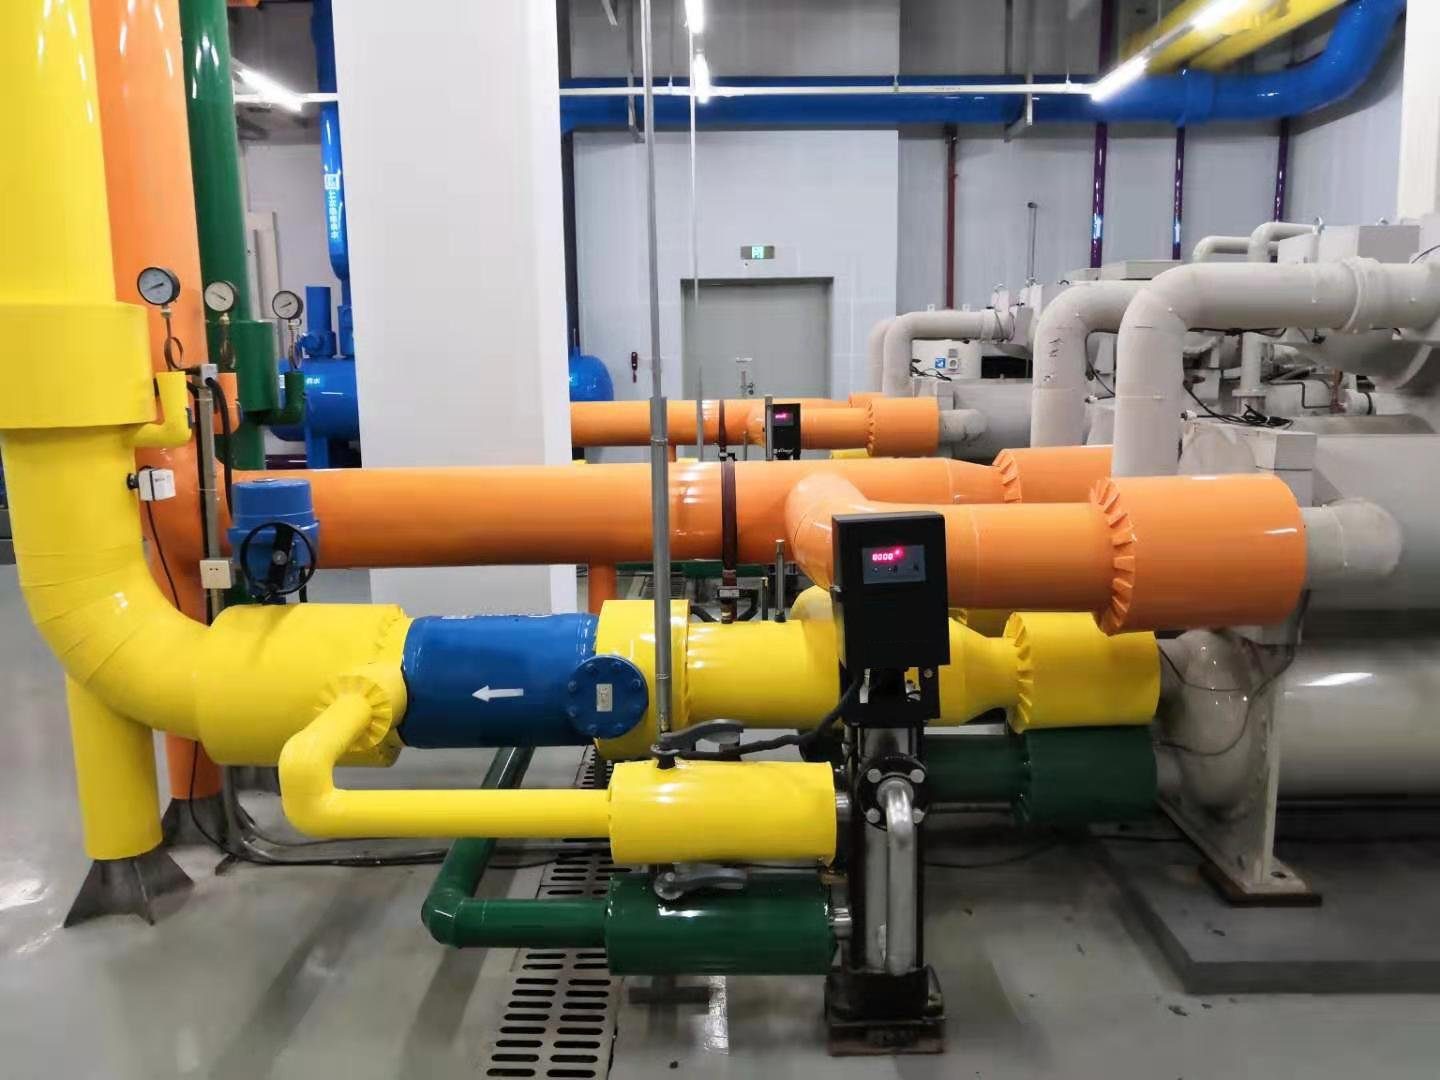
Hilton Xinglong Hainan — 3-Chiller Installation
Approach temperature held at ≈1.0°C · commissioned Aug 2018 · zero guest disruption.
Read the full case study →
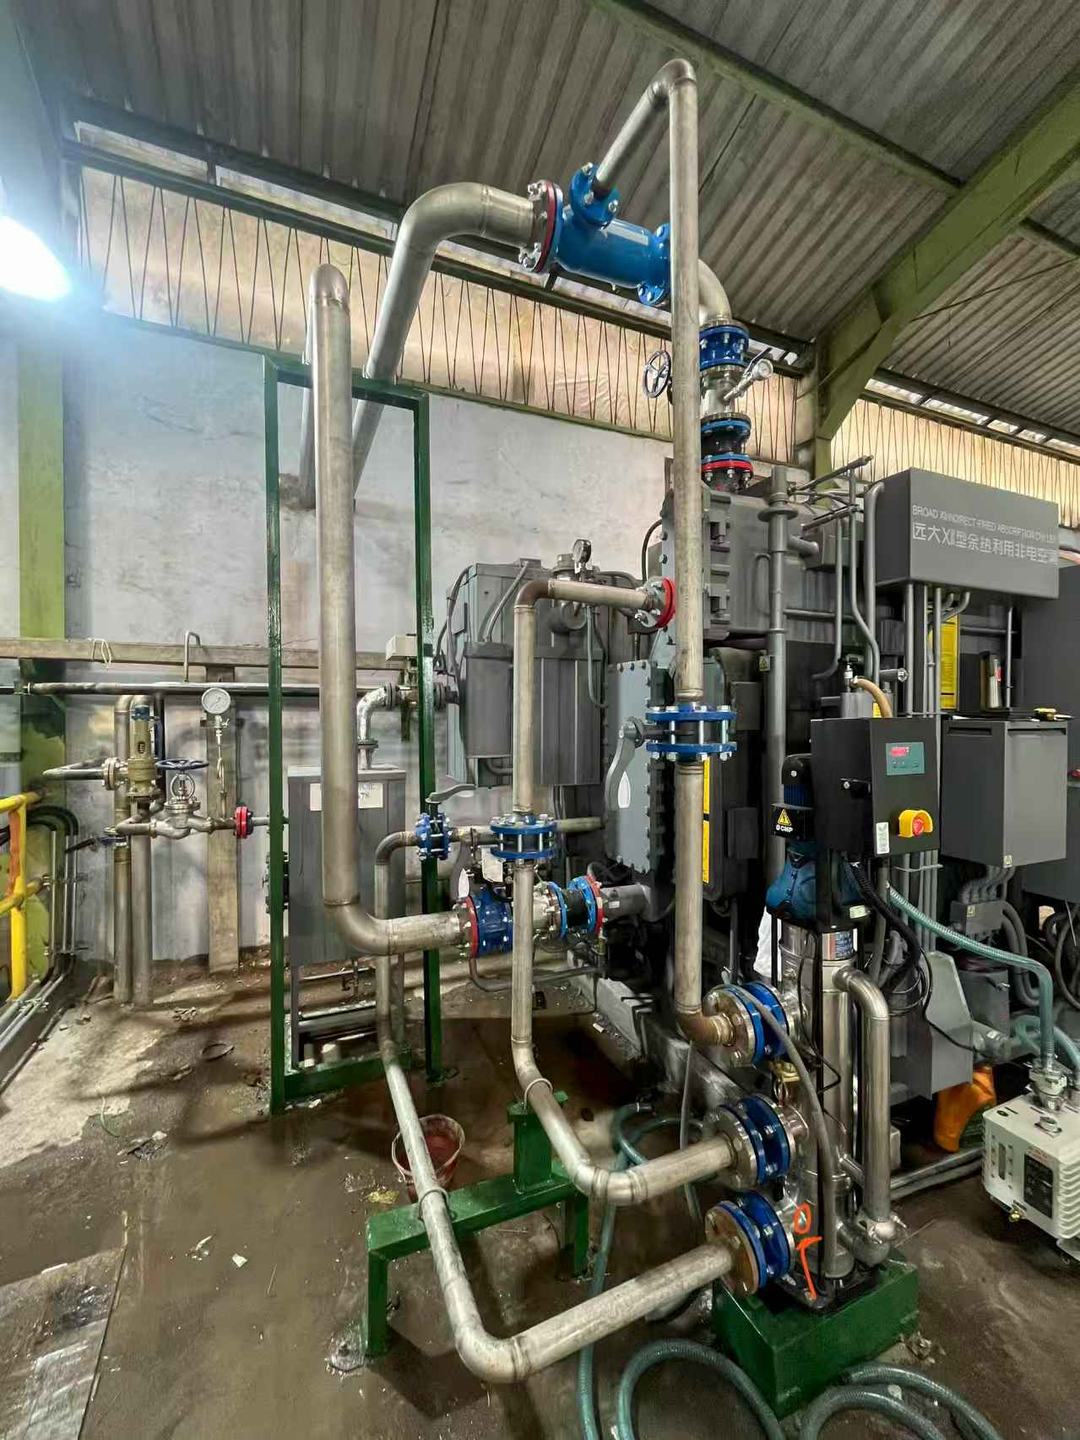
Indonesia Beverage Plant — LiBr Absorption Chiller
~15% electricity cost saving · condenser + absorber bundles · online cleaning, no shutdown.
Read the full case study →
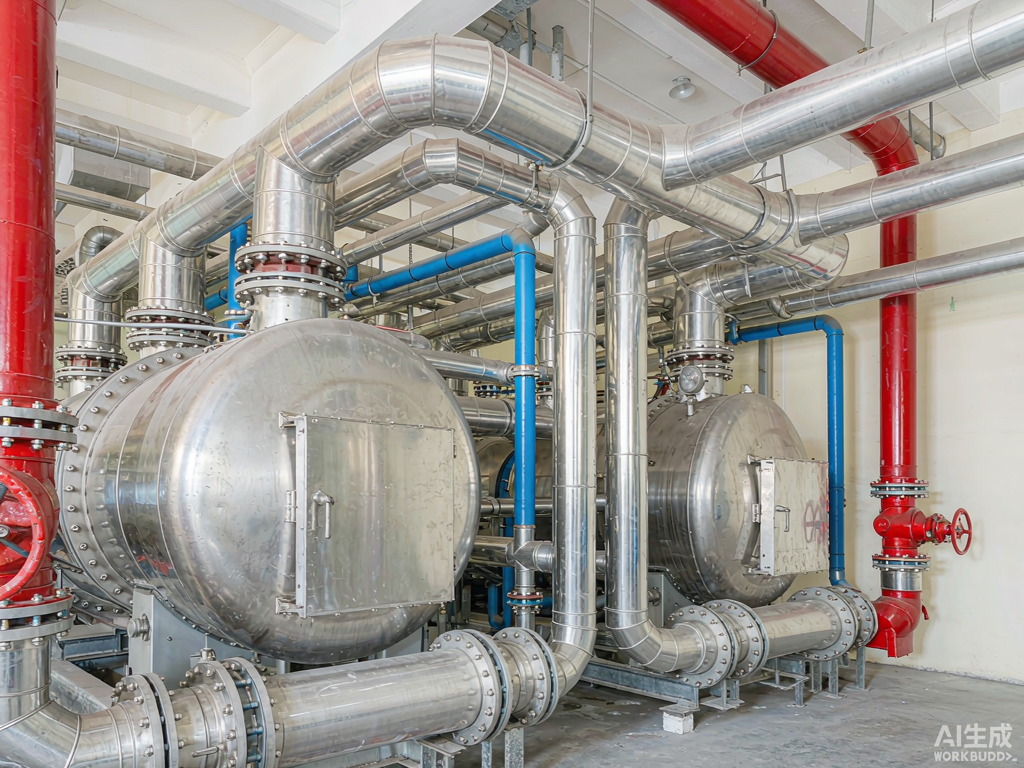
Regional Hospital – Central Chiller Plant
End-difference 3.0°C → 1.2°C · ~8% cooling capacity recovered · zero shutdown
Read the full case study →
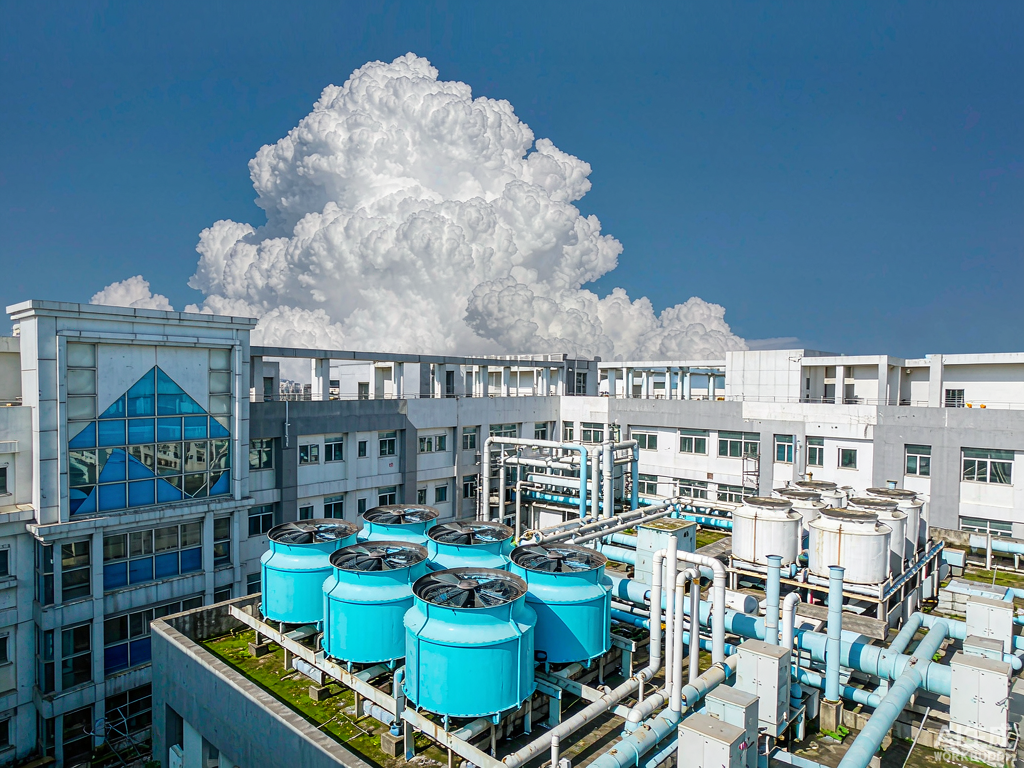
Mixed-Use Complex – Cooling Tower Dosing
Blowdown −20% · stable biocide residual · manual dosing errors eliminated
Read the full case study →
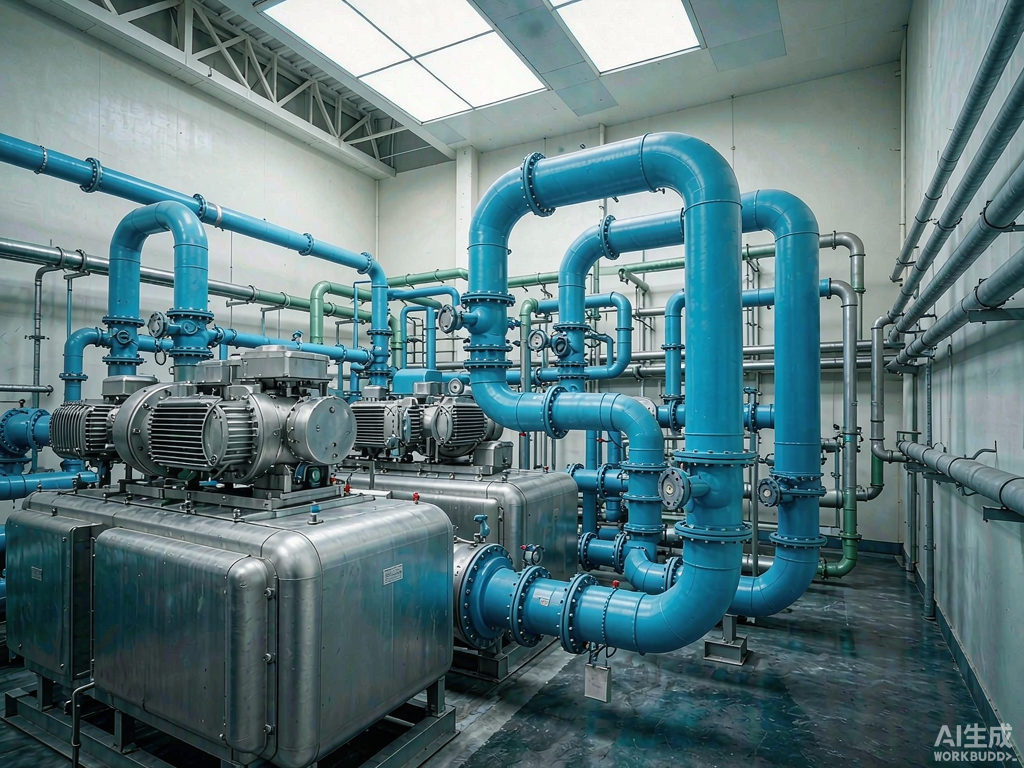
Colocation Data Center – Chiller Plant
End-difference 2.8°C → 1.1°C · ~7% chiller energy · PUE improvement
Read the full case study →
Facility Case Studies & Application Notes
See how automatic tube cleaning performs across hotels, airports, stadiums, campuses and metro systems:
